Bicycle Accidents on the Golden Gate Bridge

-Posted On March 24, 2024 In Bicycle Accidents-

This analysis covers bicycle accidents occurring on the Golden Gate Bridge from 2011 to 2023.

As a bicycle accident attorney team in San Francisco, we pride ourselves on being a valuable resource for survivors of bike accidents and sometimes for the families of bicycle riders who have suffered injuries in bicycle accidents. We are also proud members of the Santa Clara, San Mateo, and San Francisco and California Bicycle Coalitions. We know, understand, and will fight for the rights of bicyclists in San Francisco and throughout California.


2010-2023 Analysis:

  • Total Crashes: Over the twelve-year period, we identified a significant number of reported Golden Gate Bridge bicycle crashes, with varying frequencies each year.
  • Injuries: Numerous injuries were reported, including a substantial number of severe injuries.
  • Trend: Accidents are more likely to occur on weekends, particularly on Saturdays, which consistently showed higher numbers of incidents compared to other days.

Year-by-Year Breakdown

2010-2014 Bicycle Accident Graph

2010-2014:

  • Range of Crashes: 22 to 33 annually.
  • Peak Year: 2014 with 33 incidents.
  • Significant Years: 2011 only saw 15 crashes.

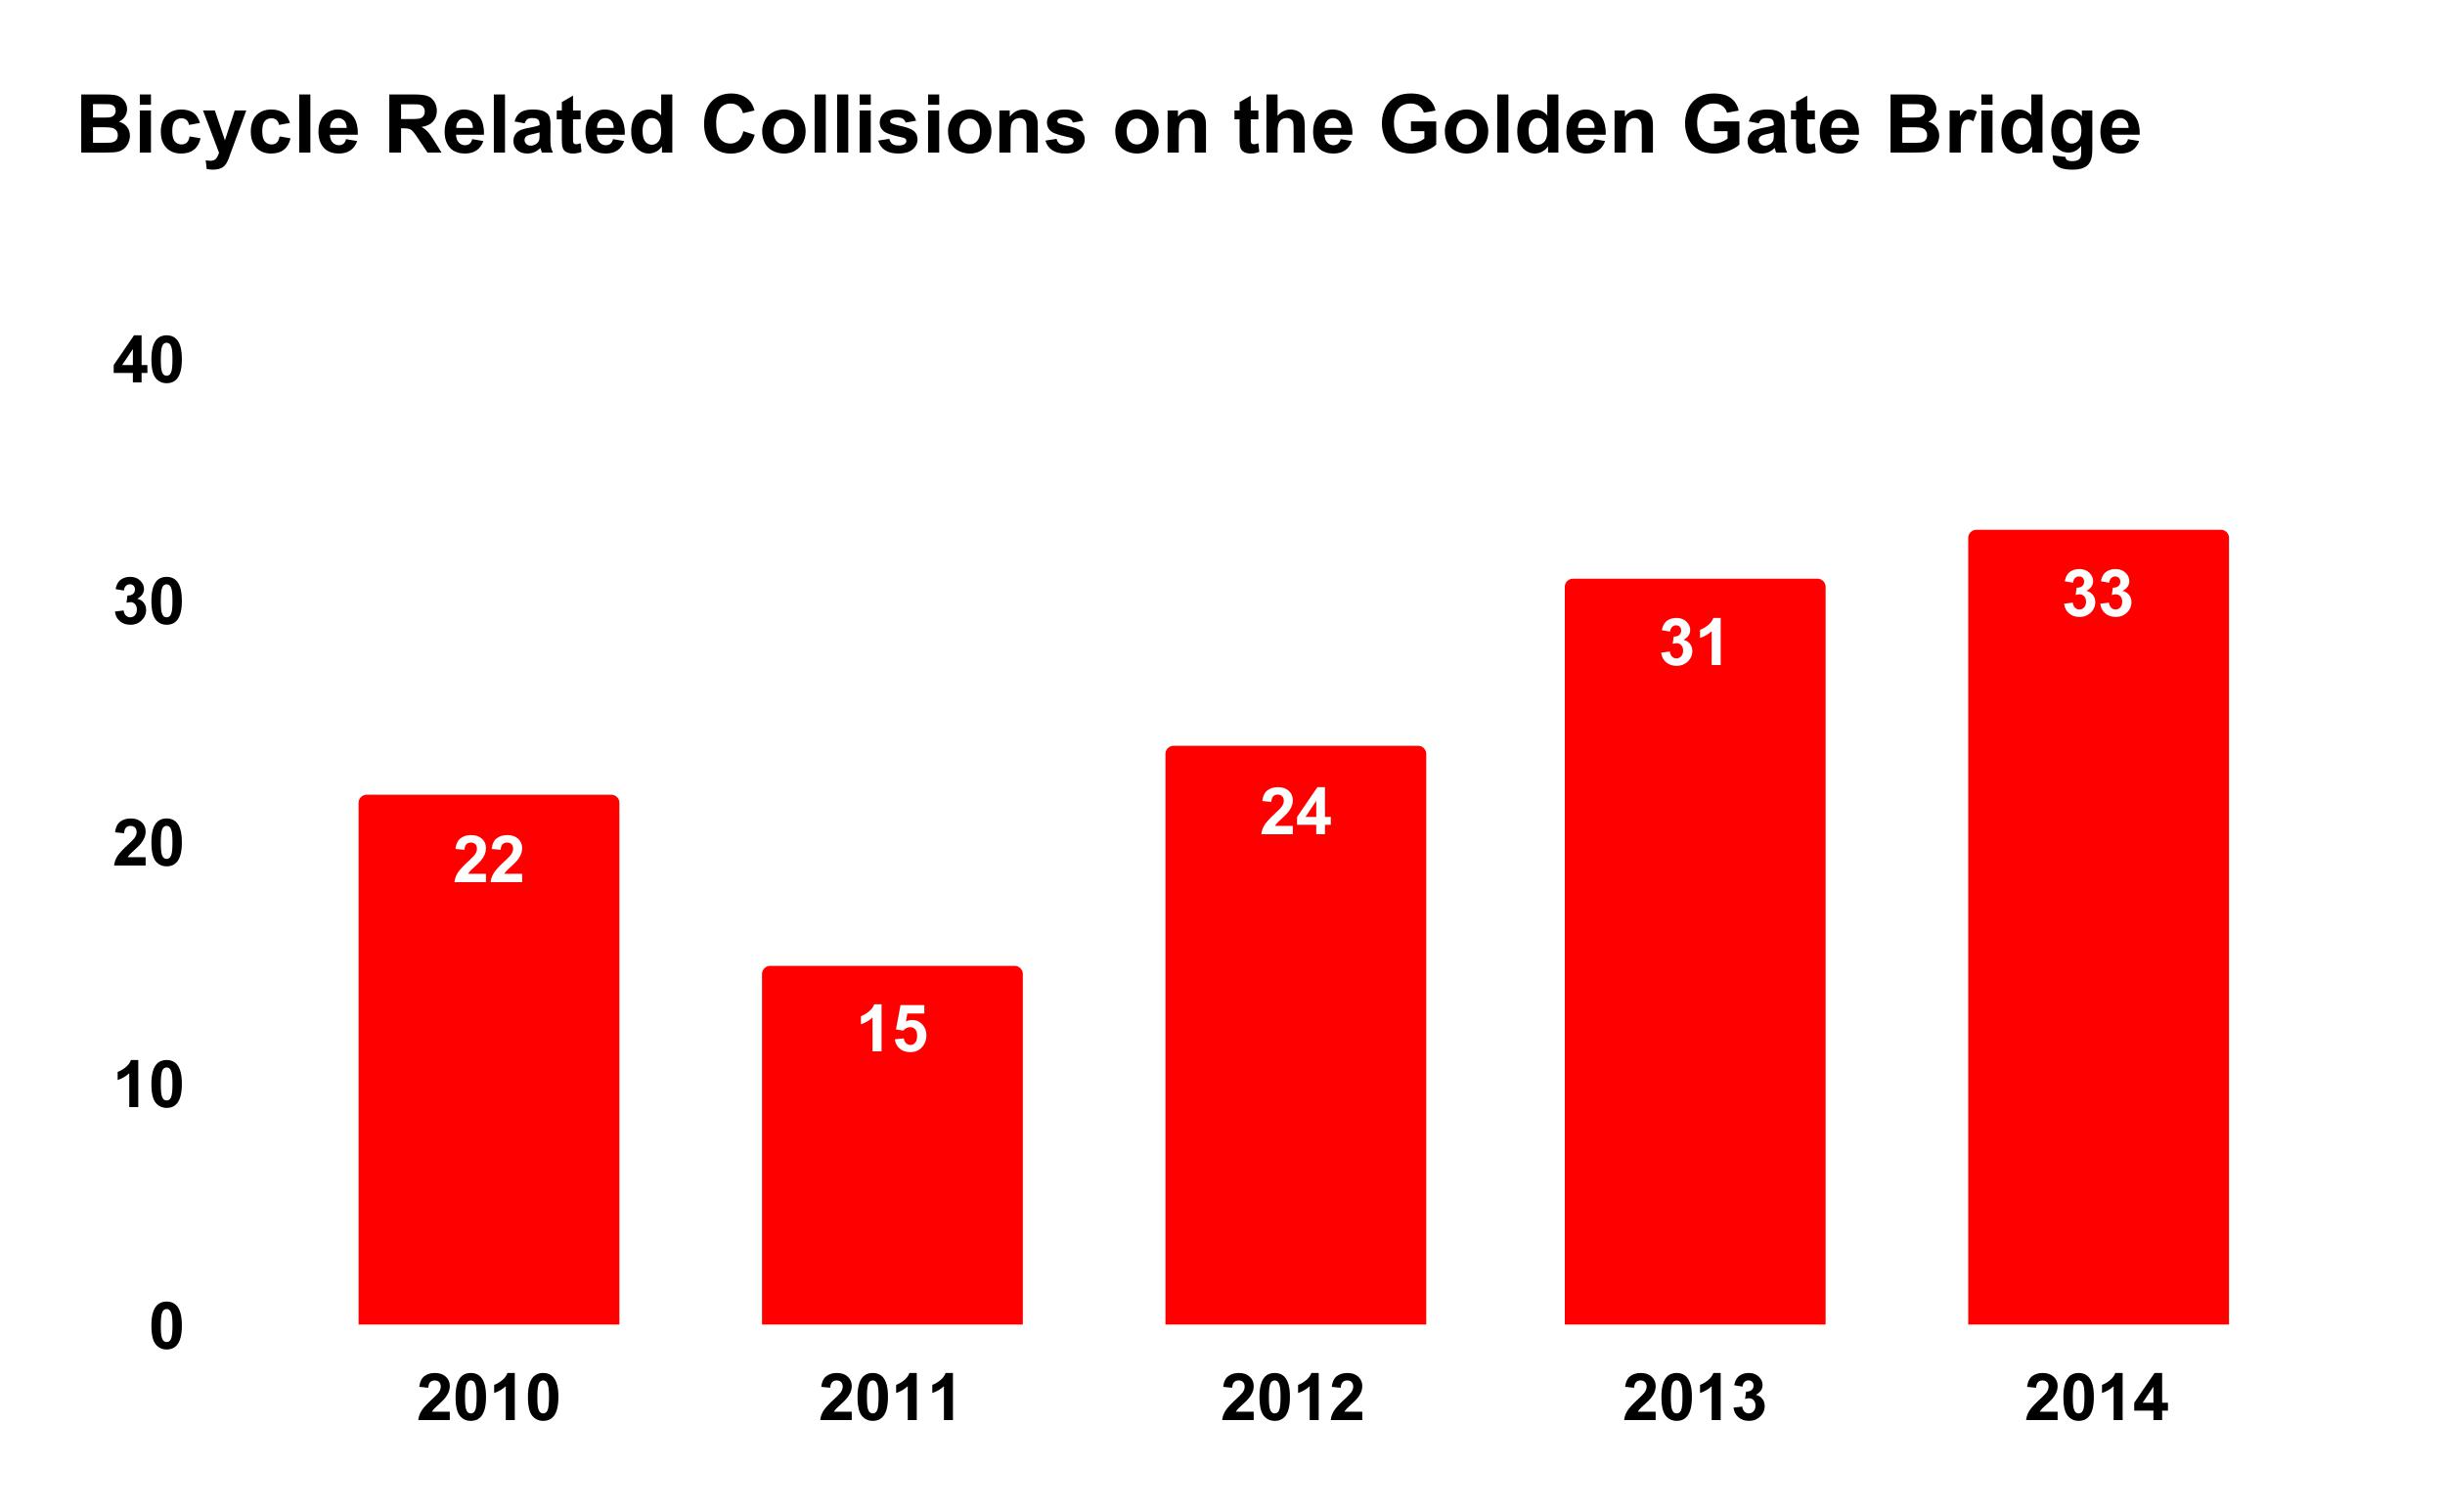
During the initial five-year period, the Golden Gate Bridge saw a notable number of bicycle accidents. The highest number of crashes was recorded in 2014, with a total of 33 incidents. These years highlighted the consistent risk faced by cyclists on the bridge.

2015-2019 Bicycle Accident Graph

2015-2019:

  • Fluctuations: Started at 33 in 2015, then dropped to 24 in 2019.
  • Significant Years: 2016 and 2017 both only saw 19 crashes each year.
  • Trend: Despite the high in 2015, the overall trend saw a decrease in accidents compared to the previous five years.

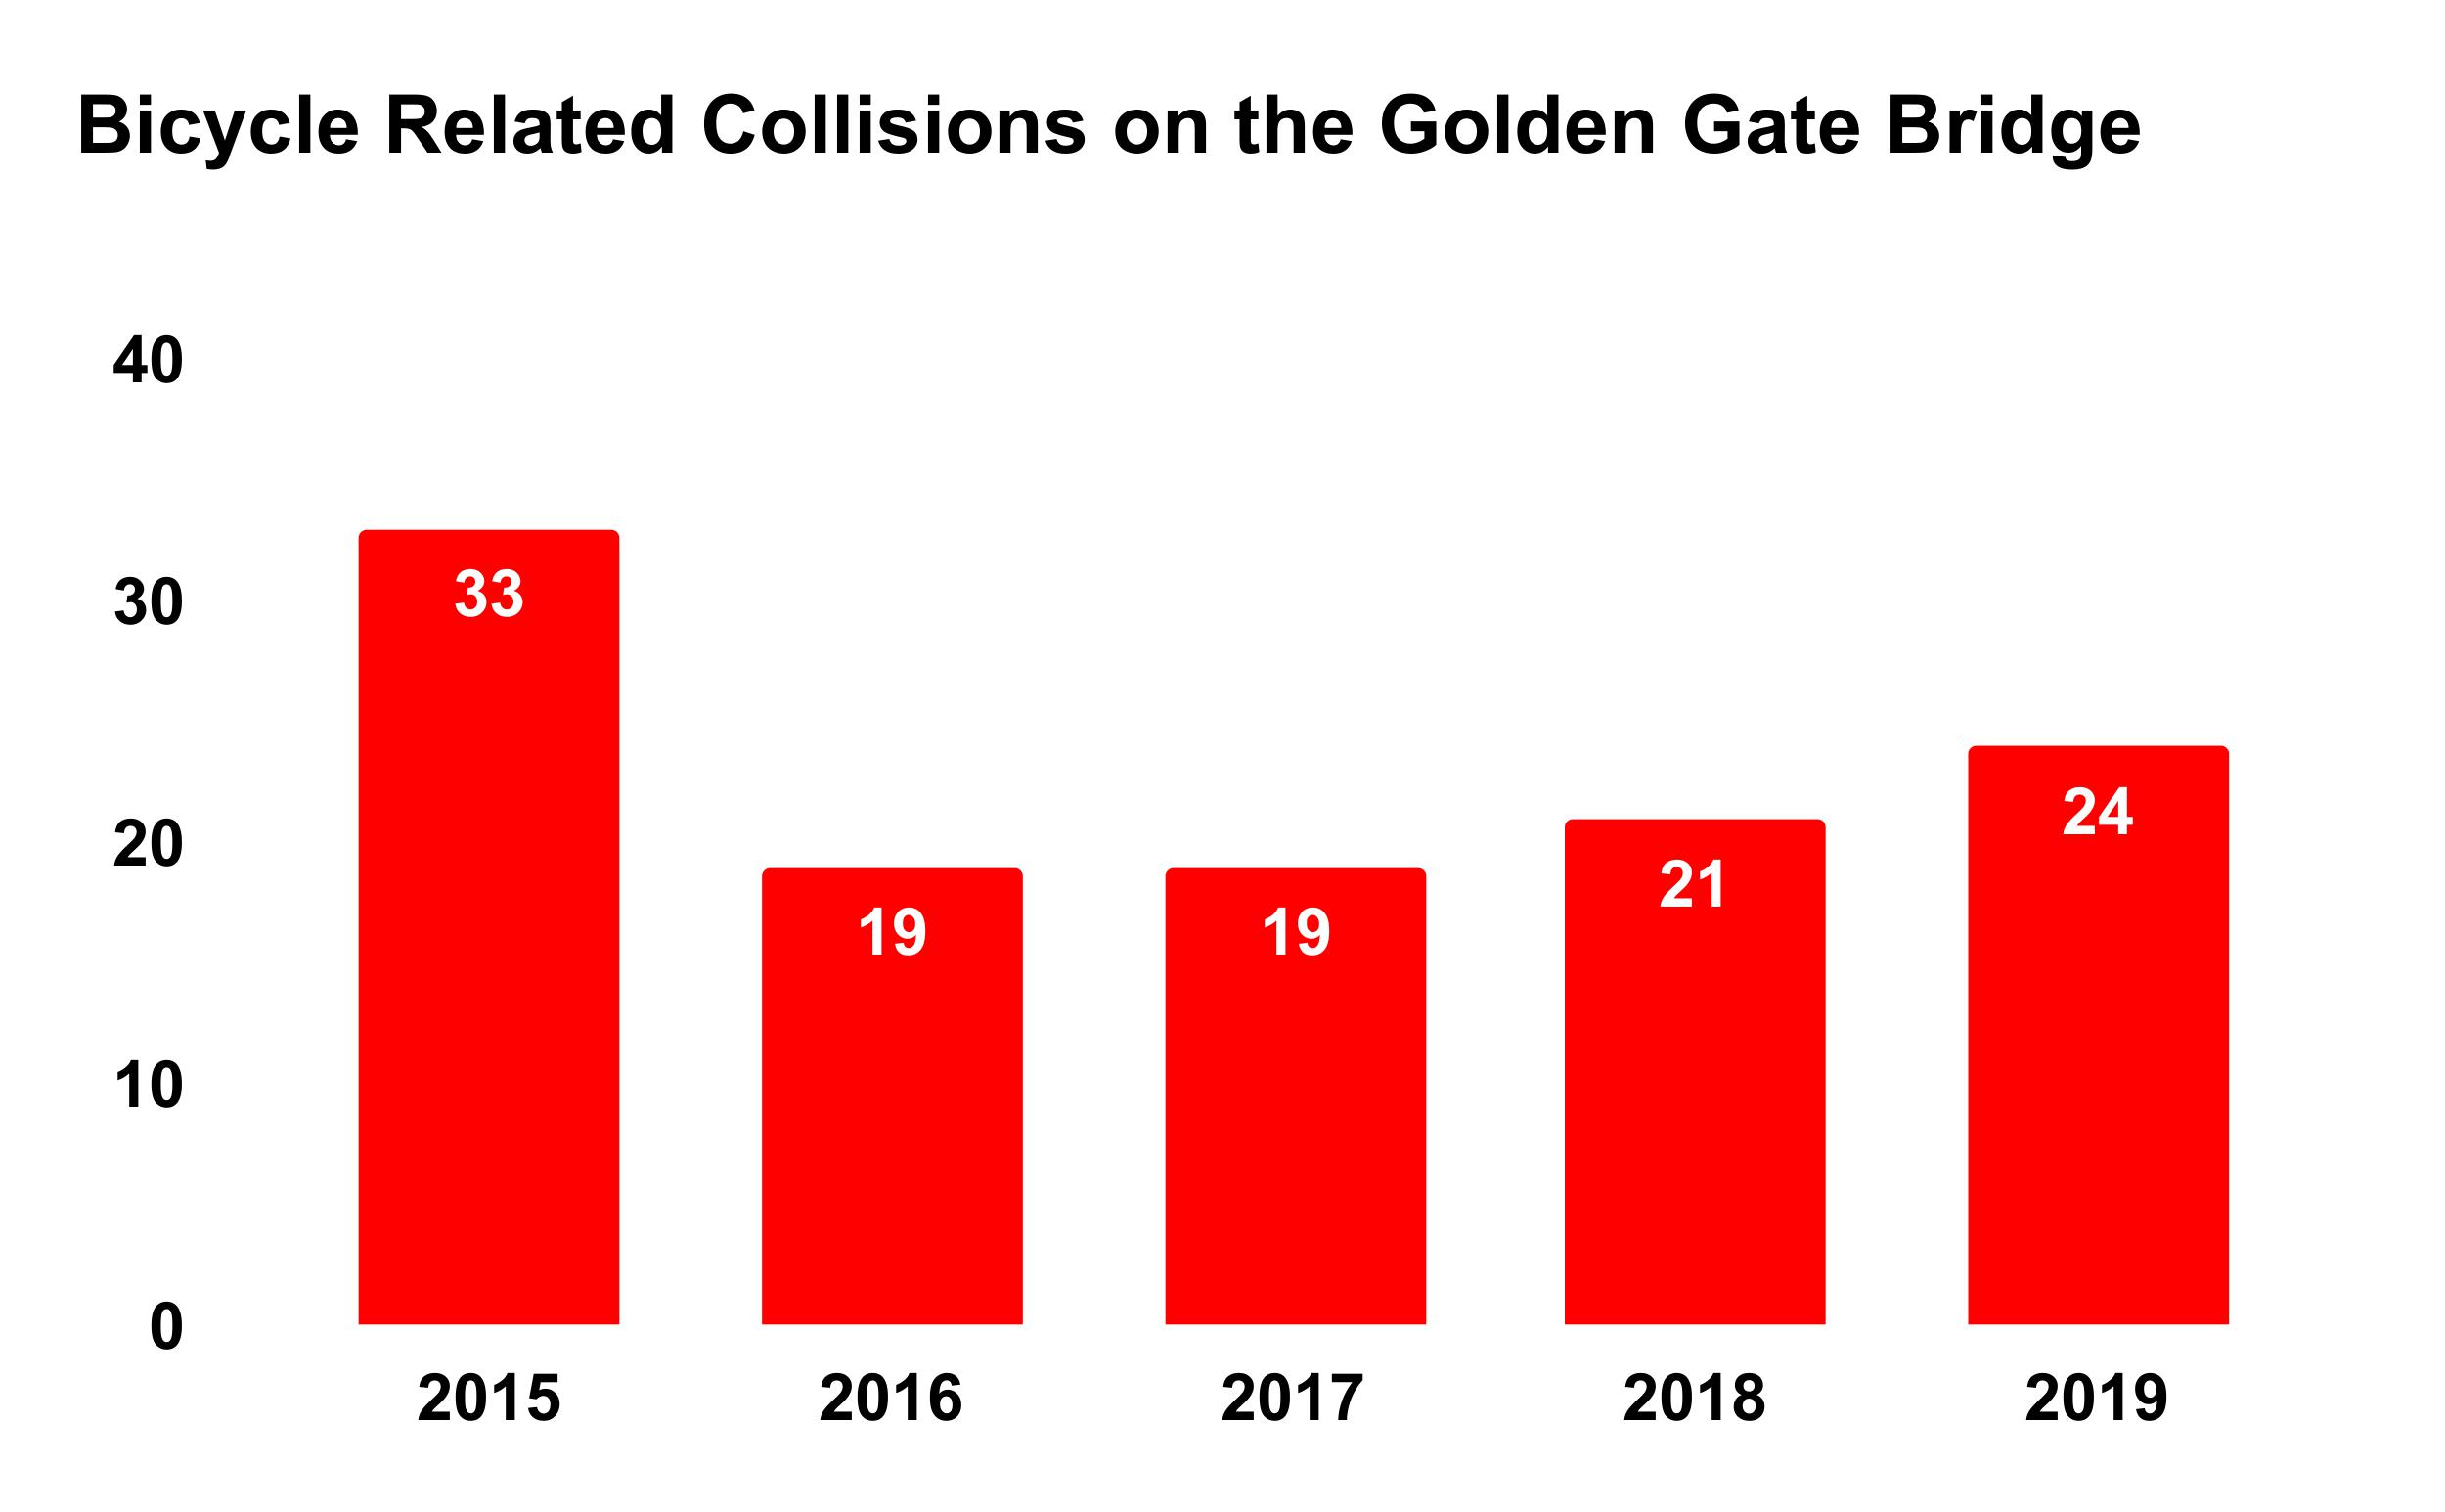
The following five years saw a decrease in the number of bicycle crashes, with a peak of 33 incidents in 2015. By 2019, the number of crashes had decreased to 24, indicating some improvement over time.

2020-2023:

  • Continuing Trends: Similar patterns of weekend accidents and tourist involvement persisted.
  • Significant Incidents: Several crashes during this period resulted in severe injuries.

In the most recent period, from 2020 to 2023, the data revealed that bicycle crashes on the Golden Gate Bridge continued at a concerning rate. The patterns observed in the previous decade persisted, with weekends, especially Saturdays, showing higher numbers of accidents. The influx of tourists, many of whom were unfamiliar with the bridge and cycling, continued to contribute significantly to the accident rate. Notably, several crashes during this period resulted in severe injuries, underscoring the ongoing safety concerns.

Crash Types and Causes by Sidewalk

Over the ten-year period from which this data was collected, there was nearly a 50% split between east sidewalk and west sidewalk bicycle crashes. Here is a breakdown of the reported cause of bicycle accidents on each respective sidewalk from 2010-2019.

East Sidewalk (121 total collisions)

  • 33 Maneuver around bicyclist – 27%
  • 27 Maneuver around pedestrian – 22%
  • 4 Construction involved – 3%
  • 2 Wind involved – 2%
  • 3 E-bike involved – 2%

West Sidewalk (120 total collisions)

  • 47 Maneuver around bicyclist – 39%
  • 3 Maneuver around pedestrian – 3%
  • 6 Construction involved – 5%
  • 7 Wind involved – 6%
  • 2 E-bike involved – 2%

Bicycle crashes involving pedestrians often occur when pedestrians attempt to maneuver around cyclists, leading to dangerous and sometimes severe accidents. During the period where this data was collected, pedestrians attempting to move around a bicyclist accounted for the highest percentage of accidents regardless of sidewalk location. The unpredictability of pedestrian movements makes it difficult for cyclists to anticipate and react in time to avoid collisions. Such crashes can result in serious injuries for both parties, including fractures, head injuries, and other trauma.

How Does Speed Impact Golden Gate Bicycle Collisions?

Out of the 241 reported bicycle collisions on the Golden Gate Bridge, 21% characterized speed as a recorded factor that impacted the accident. While this is a significant amount, 77% of the crash data collected listed speed as an unknown factor relative to the collisions.

Victims Requiring Ambulance Transportation

58% of the bicycle collisions reported that a victim needed ambulance transportation for their injuries.

While 77% of the crashes couldn’t determine the impact speed had on the collision, in the 140 crashes where ambulance transportation occurred, there were nearly 10% more incidents where speed was a factor.

This suggests that bicycle accidents reported at higher speeds more often required ambulance transportation. This is likely due to an increase in injury severity that can be expected from high-speed bicycle collisions.

Notable Incidents

Severe Injuries (2011-2020):

  • July 23, 2011: One severe injury at 5:05 PM on a Saturday.
  • December 20, 2012: One severe injury at 8:09 AM on a Thursday.
  • January 19, 2013: One severe injury at 2:25 PM on a Saturday.
  • June 27, 2013: One severe injury at 4:40 PM on a Thursday.
  • July 10, 2014: One severe injury at 5:35 PM on a Thursday.
  • October 11, 2014: Two severe injuries at 4:50 PM on a Saturday.
  • January 28, 2017: One severe injury at 12:40 PM on a Saturday.
  • March 12, 2017: One severe injury at 12:56 PM on a Sunday.
  • August 3, 2017: Two incidents, one severe injury at 11:30 AM on a Thursday.
  • December 10, 2017: One severe injury at 1:00 PM on a Sunday.
  • September 27, 2018: One severe injury at 3:35 PM on a Thursday.
  • November 2, 2018: One severe injury at 9:41 AM on a Friday.
  • January 26, 2019: Two incidents, one severe injury at 8:23 AM and another at 1:40 PM on a Saturday.
  • May 12, 2019: One severe injury at 2:52 PM on a Sunday.
  • August 9, 2020: One severe injury at 9:01 AM on a Sunday.
  • October 14, 2020: One severe injury at 6:21 PM on a Wednesday.

Severe Injuries (2021-2023):

  • June 15, 2021: Two severe injuries at 2:30 PM on a Saturday.
  • September 10, 2021: One severe injury at 4:45 PM on a Friday.
  • May 23, 2022: One severe injury at 11:15 AM on a Sunday.
  • August 12, 2022: Two cyclists hospitalized at 3:05 PM on a Friday.
  • November 5, 2022: One severe injury at 12:20 PM on a Saturday.
  • February 18, 2023: One severe injury at 2:50 PM on a Sunday.
  • April 29, 2023: Two severe injuries at 10:30 AM on a Saturday.

Safety Measures and Recommendations

Given the ongoing risks, it is imperative that both regular users and visitors take extra precautions while cycling on the Golden Gate Bridge. Here are some recommendations based on our findings:

  • Increased Signage: Enhanced signage to alert cyclists to high-risk areas and provide safety tips.
  • Education Programs: Initiatives targeting tourists, such as safety briefings at bike rental shops, to inform them of the bridge’s unique challenges.
  • Enhanced Pathways: Further improvements to the protected bike paths, including better separation from pedestrian traffic.
  • Emergency Response: Faster and more efficient emergency response mechanisms to address accidents promptly.

The Golden Gate Bridge remains a scenic and popular cycling route, but the risks associated with it cannot be ignored. By understanding the patterns and causes of bicycle accidents, we can work towards creating a safer environment for everyone.

Stay safe and enjoy your ride on the Golden Gate Bridge!

Awards & Recognitions
award item image
award item image
award item image
award item image
award item image
award item image